
The Market is confused on Fidelity. Stephen Chernin/Getty Images News
What if I told you there was a stock in this market trading almost half its valuation issuing a 4% dividend yield? What if I told you it grants exposure to real estate without the same level of volatility risks associated with traditional real estate stocks and is being punished as if it is as risky as the riskiest plays in real estate? Do you want to know what “it” is? Ladies and gentlemen, I introduce you to Fidelity National Financial (NYSE:FNF), and no, not that Fidelity with the cliche overdone commercials that you see every other break on CNBC. Nor is it the Fintech player Fidelity Information Services (FIS). (Seriously, why are all these financial companies fixated on the word “fidelity”?)
In this article I am going to show you why I believe Fidelity to be a great value by way of a couple DCF models. I am also going to make the case for why I think its high-yielding dividend positions Fidelity as a fair play in a recessionary environment for an investor that craves diversity. Then I will show you how harsh broader negative sentiment within the industry has unfairly hurt Fidelity. Lastly, I will cover cashflow stability and explain how revenue will fair if recessionary fears are realized.
An Intro to the Firm
First, let’s breakdown Fidelity and its core business. Fidelity has three primary segmented cashflows. First, Title, which classifies the bulk of their Title Insurance business and Escrow and all other title-related services including trust activities, trustee sales guarantees, and home warranty products which makeup an eye-popping 32.6% of the TOTAL US Title Insurance Market (according to their 10-K form as of 3Q 2021). Second, F&G a relatively new segment added after a recent merger which is responsible for insurance solutions serving retail annuity and life customers. Third, the Real Estate Technology (Corporate and Other)segment compromised of subscription revenue primarily from software provided to real estate professionals. The empirical data appears like this:
Disaggregation of Revenues (Company 10-K 2021)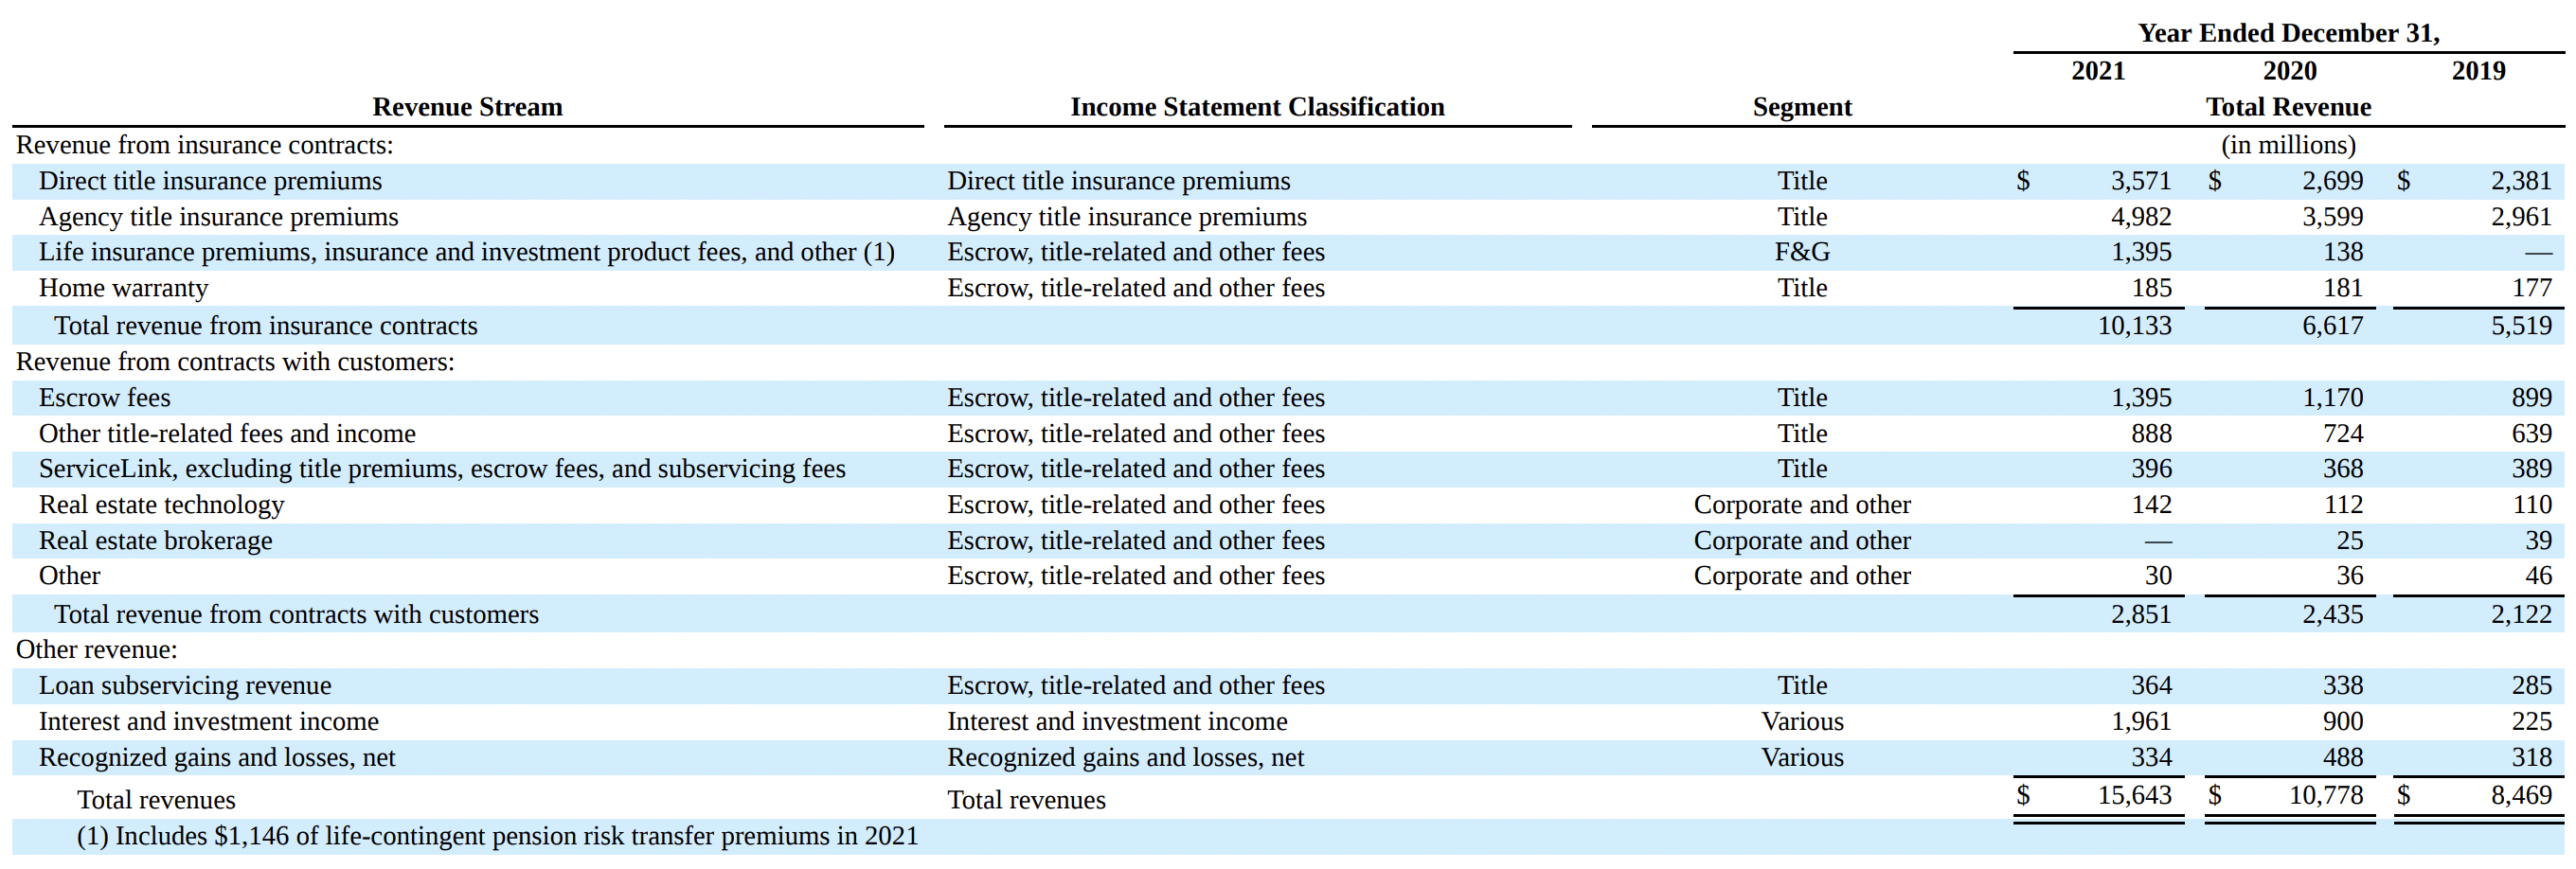
Fidelity is Oversold
Everyone in the country not named Janet Yellen knows that a recession is looming. Meanwhile the market seems to think that a recession incoming means the entire Real Estate market is junk. Indiscriminate sector wide selling has resulted in uncharacteristic price volatility for Fidelity. Take for example the 52 week high of the Homebuilder ETF (ITB). Currently ITB is roughly 36% off their 52 week high compared to Fidelity which is 34.78% off its 52 week high. Obviously this close pricing correlation between the two firms is suspect. In a recessionary environment, brand new homes are always the hardest hit since the few consumers actually looking to purchase homes will settle for older properties. But don’t just take my word for it, here is a graph exploring the pricing correlation between the two firms from our last recession in 2008:
2008 – 2013 (Trading View)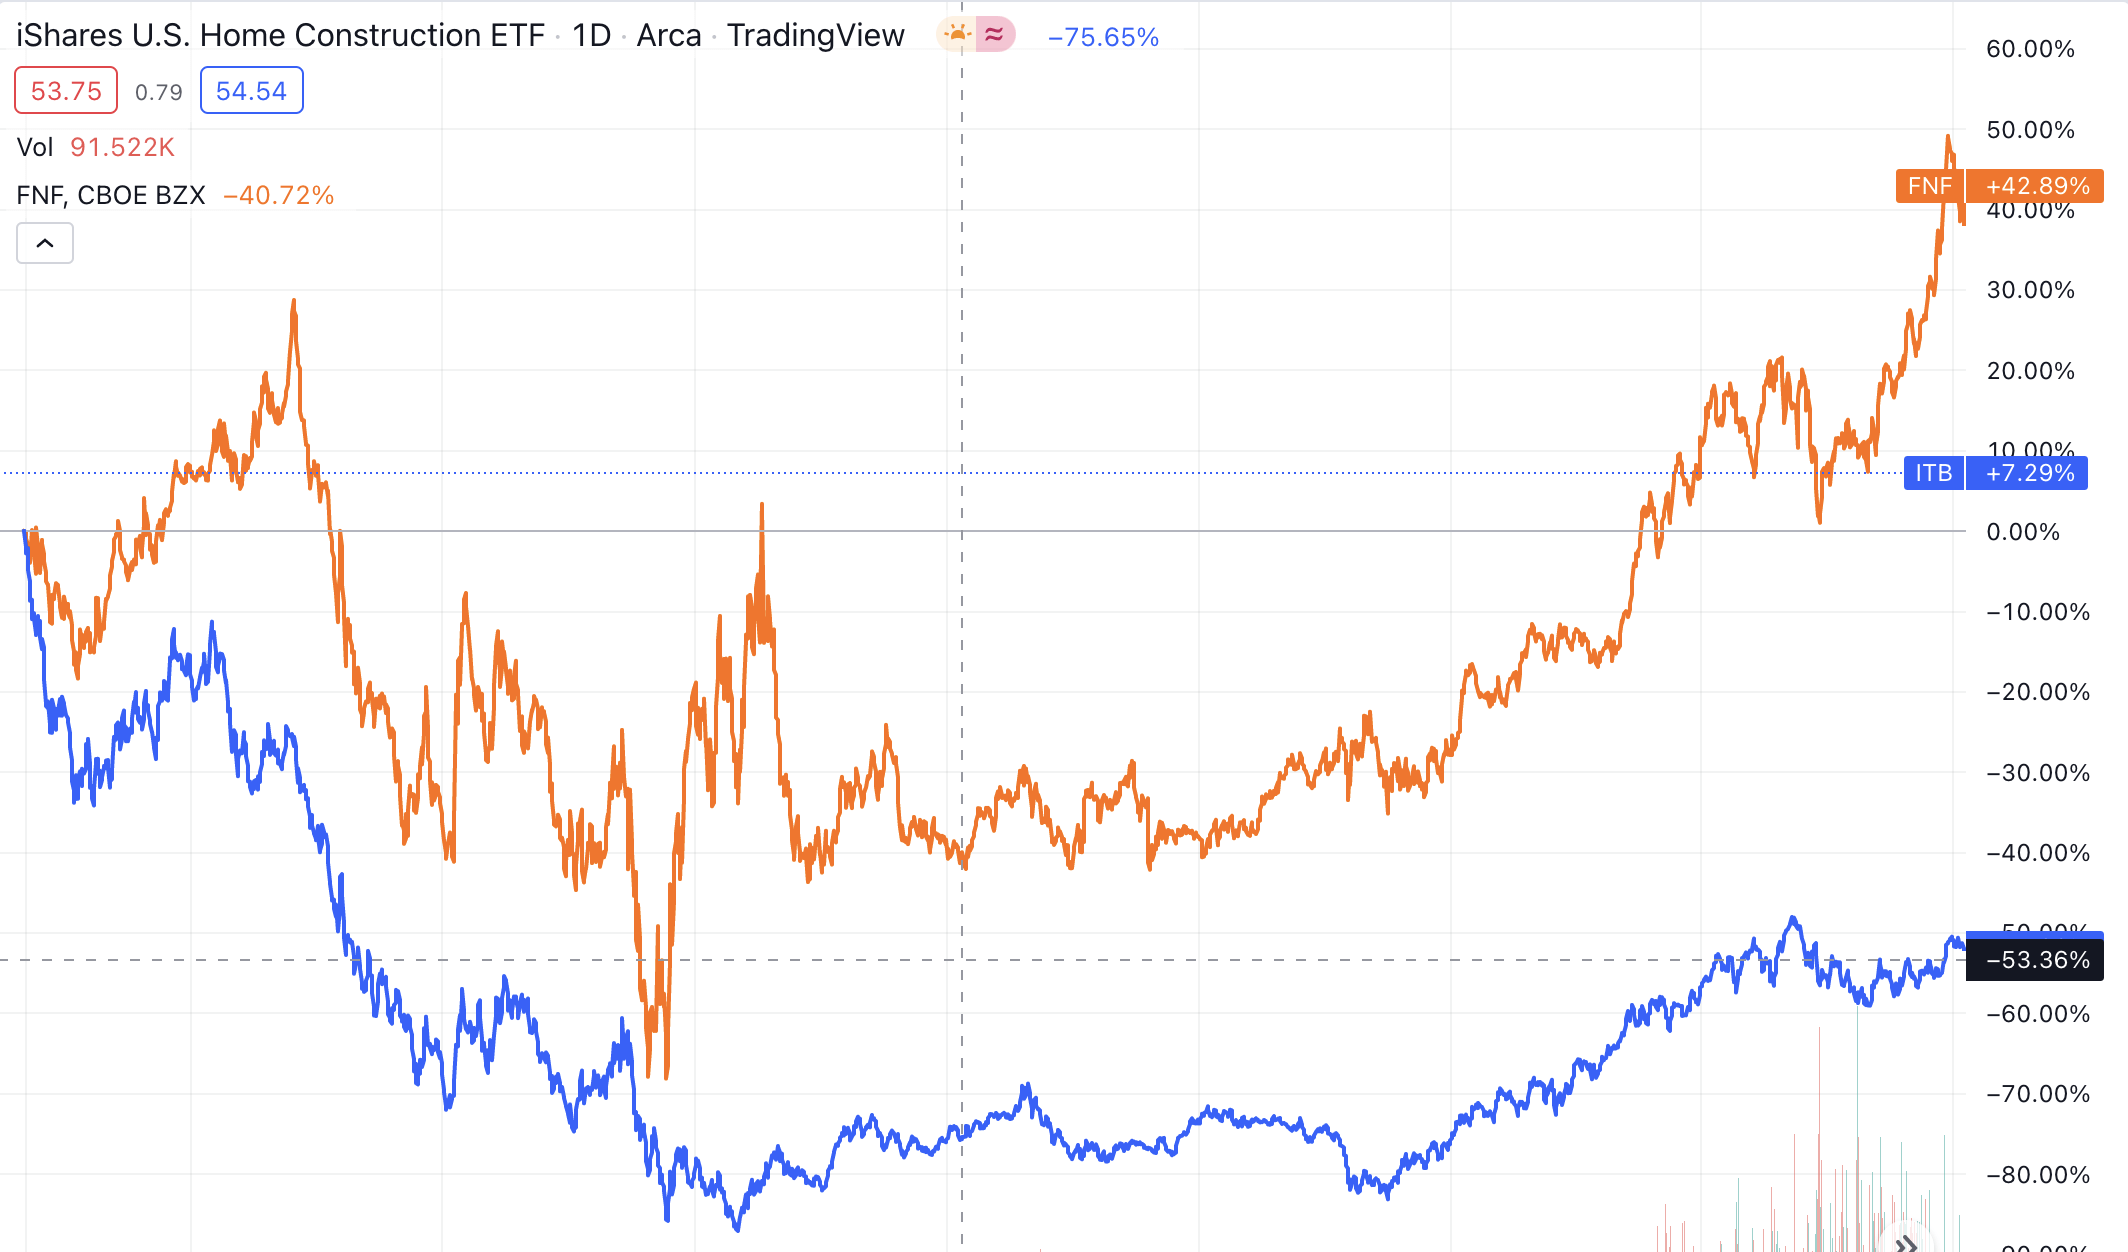
As you might expect, the gap between the two was tight in the initial stages of the downturn but widened as time went on. When you compare the two firms in the past year things significantly tighten showcasing the unusual trading activity recently:
2022 (Trading View)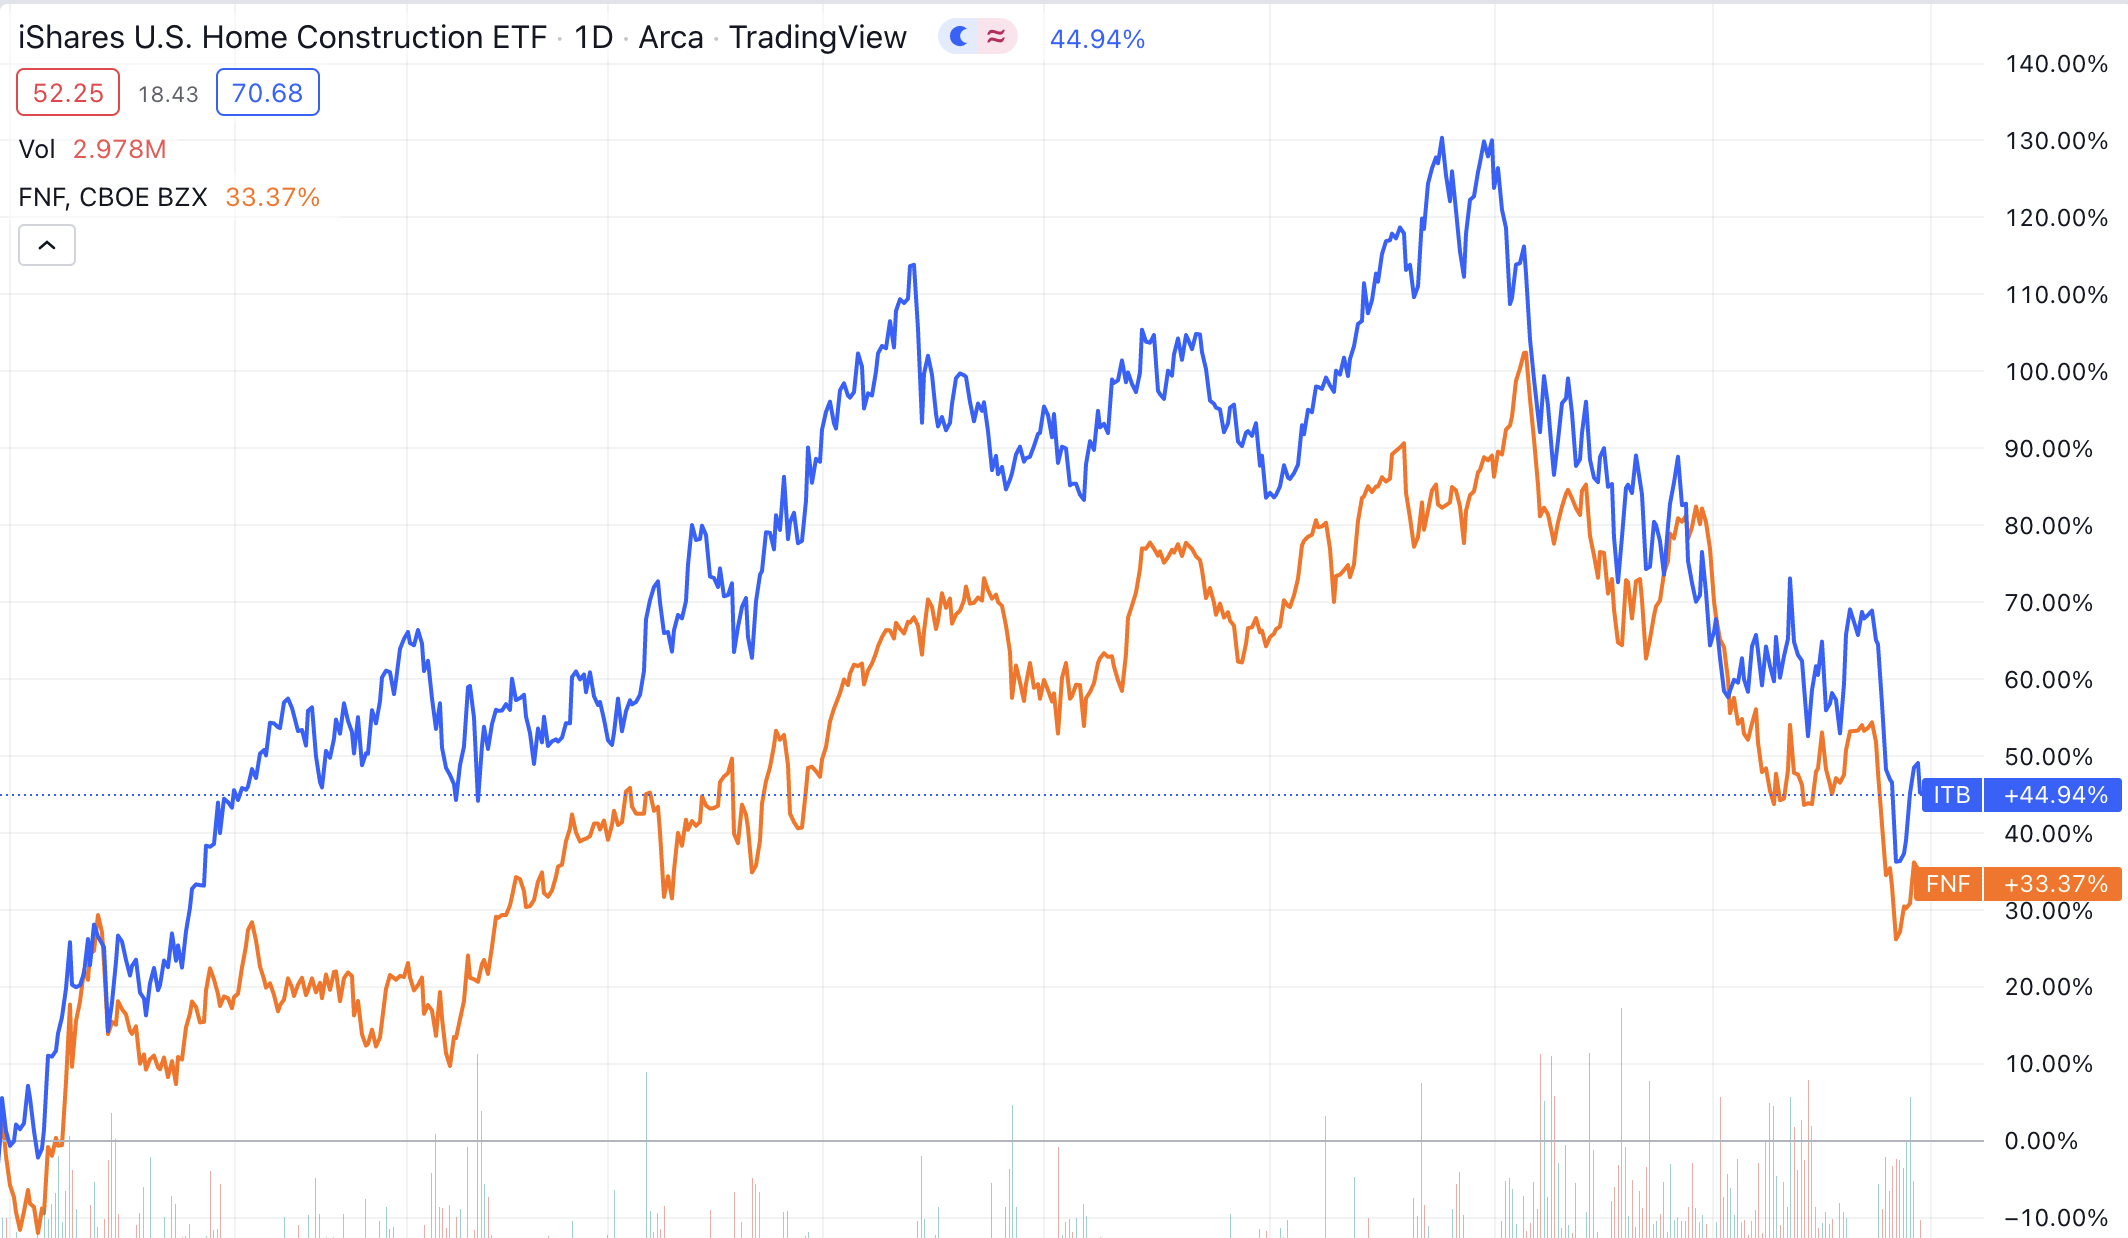
As much is emphasized by their similar 52 week high numbers I mentioned earlier. I believe the market is punishing Fidelity unfairly by treating them similar to the homebuilders which we know to be more volatile. As time goes on, I think the charts will fix themselves and the homebuilders will widen the gap skewed to the downside. I also believe that the market is projecting this recession to have a similar impact on Fidelity in regard to profitability as it did in 2008.
But This Isn’t 2008…
While Fidelity wasn’t the most punished firm during the housing crisis, they did experience long lasting effects. For starters, they realized nearly a 15-20% decline in title insurance premiums industry wide (more on this later). Profitability was a huge issue as mortgage fraud emerged for several years after the heart of the crisis. PilotOnline.com published an article in 2011 highlighting some key metrics regarding profitability and how the title insurance industry was still shaken to the core from a slew of fraudulent activities. The industry recorded an operating loss of more than $206 million in 2010 compared to an operating loss of $134 million in 2009 while dozens of providers were forced to close as more and more cases caught up with them. Heather Meahl, vice president of American Home Title said at the time:
When the housing market was booming, orders were getting pushed through and some agents and offices weren’t paying close enough attention to critical details; unfortunately there were also a very few who took advantage of an opportunity to unscrupulously turn a profit . . . Title searches were done too quickly, underwriting was sloppy, and necessary due diligence wasn’t being done.
Yet the gap between Fidelity and the homebuilders remained large while Fidelity outperformed even through an industry crisis along with their sector crisis from 2008 to 2013. Investors are seriously missing something if they attempt to justify a repeat of 2008 for Fidelity as these conditions now are nowhere near as dire as they once were.
Story for the Fundamentals
As I said before, it is very important to note that Fidelity is NOT poised to be a direct recession hedge nor is it in-itself a valuable play against recession, rising rates, or inflation when compared to the broader market. It is however a solid play for an investor that wishes to maintain a diversified portfolio. Fidelity IS a safe way to keep your toes in the water for real estate exposure. In this section I am going to go over the different fundamentals essential for crafting a discovering an intrinsic value for the firm in an effort to further explain why I believe there to be a decent margin of safety.
Revenue Stability
Earlier I cited numbers from the Insurance Journal that indicated a decline of 15 to 20% in insurance premiums during the heart of the last downturn. While I was insistent earlier that this recession will be much different for Fidelity than the last, it is safe to assume these demonstrative revenue numbers will resurface as fewer people are searching for new homes. In other words, if any empirical data from 2008 is relevant, it would be the revenue numbers. For Fidelity a 20% decline in title industry premiums would actually be more like a 17.5% since some of the revenues are not connected to title insurance (as discussed in the segment breakdown) thus I adjusted the revenue decline metric. I expect the gross decline of insurance premiums to moderate in years 2 – 4 thus I give them a modest 2.5% decline in revenues for those years. The 10 year revenue breakdown will thus look like this:
Revenue Story (Author’s DCF Model)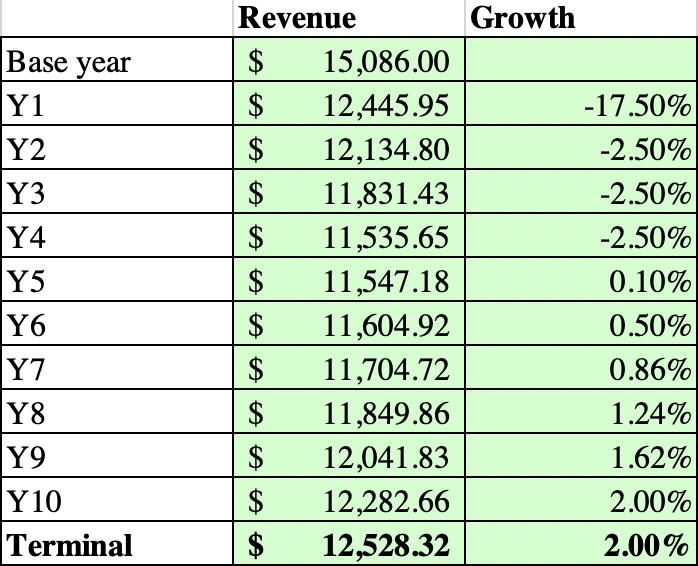
It is important to note that this decline is expecting a recession to hit sometime within the next 12 months. It is perfectly plausible that the recession is outside this window or that housing doesn’t feel the brunt of the effects until later. Despite the possibility of these variables, they shouldn’t make an impact on our final intrinsic value.
But those still bearish may not be convinced that the premium decline will be only 20%. Thus, I concocted a second narrative based around a title industry premium decline of 30% – 35% instead:
Revenue Story Bearish (Author’s DCF Model)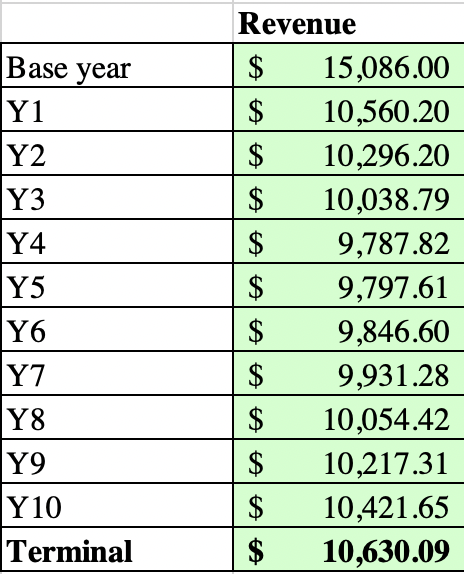
Profitability
With revenue taken care of, we can move onto the more difficult part of the valuation: deciphering profitability impacts from the decline in revenue. This task is especially difficult given the prevalent nature of inflation currently. The 2022 TTM operating margin for Fidelity is 19.66% after normalizing operating leases. The GAAP EBITDA was 24.12%. When looking historically, Fidelity realized an EBITDA of 8.74% – 13% in the years after 2008. As I said before, the post-2008 EBITDA numbers are suspect and can’t be used as a valuable relative comparison given the problems with fraudulent activity at the time within the space. We can, however, use this number as a standard for the low of a range when looking at the firm’s numbers. I seriously doubt that Fidelity will realize an equivalent to the abysmally low EBITDA in 2009 (which was the 8.74%) given the strength of the margin now. Instead of participating in the futile exercise of estimating a margin, I feel that taking a contrarian approach and estimating levels slightly below their numbers is the best course of action. Next year they will undoubtedly experience intense margin pressure but gi
ven their track record, it should return to normal at a moderate pace. Due to a long-term bullish outlook, I think that the firm in the terminal year can reach an operating margin of around 16-17%, that’s good for an EBITDA around 20-21%. All of this amounts to my projections for profitability below:
Profitability (Author’s DCF Model)
Intrinsic Value
With our story laid-out for Fidelity, we can now move onto the juicy finale, the DCF models.
First is the base case which takes the initial assumptions I made at face value:
Base Case (Author’s DCF Model)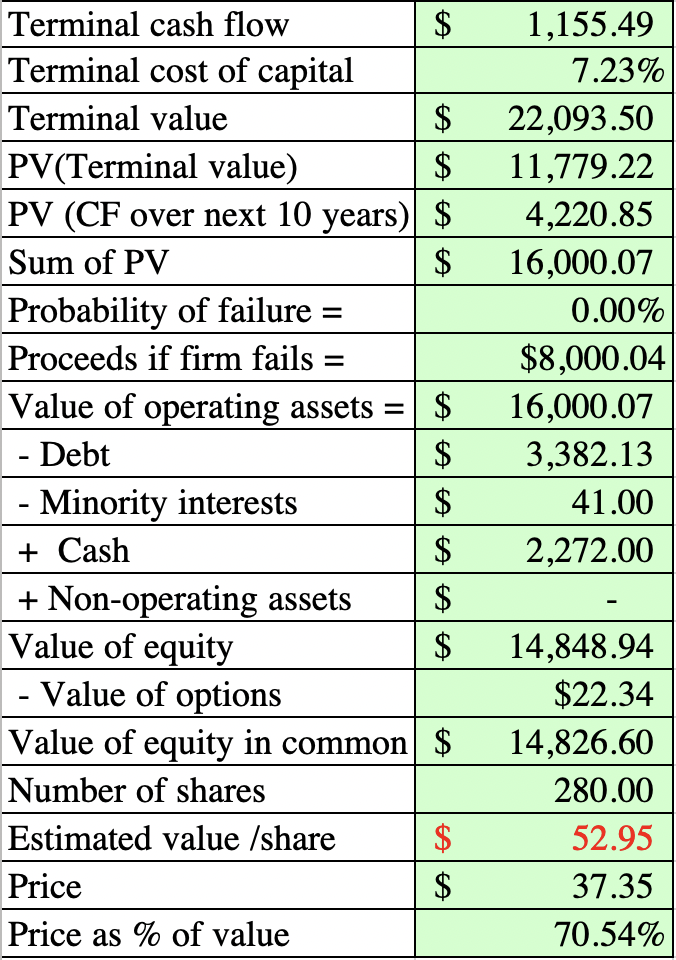
Considering a modest 17.5% decline in revenues (and 2.5% in the ensuing years), we are led down a path to an intrinsic value for the entire firm of $52.95. FCFF looks to be $1.15 billion in the terminal year even after factoring in a modest decrease in sales AND a protracted recovery. Thanks to the low industry beta and isolated equity risk exposure, cost of capital is a very low and attractive 6.18% leading into a terminal cost of capital of 7.23% (the normal number for a mature firm). Overall, the base case screams a buy especially given the relative intrinsic value for the real estate sector. The sentiment of this valuation is ultimately “conservative” in nature and I give a confidence score on this valuation a 4/5. My sentiment is driven by the fact that I am almost certain a recession is incoming and that the implications that this recession would have on Fidelity will be fully realized. (This model was completed on June 29th using a risk-free rate of 3.3%)
For those who are still not sold, I have created a second case that is much more on the bearish side of sentiment:
Bear Case (Author’s DCF Model)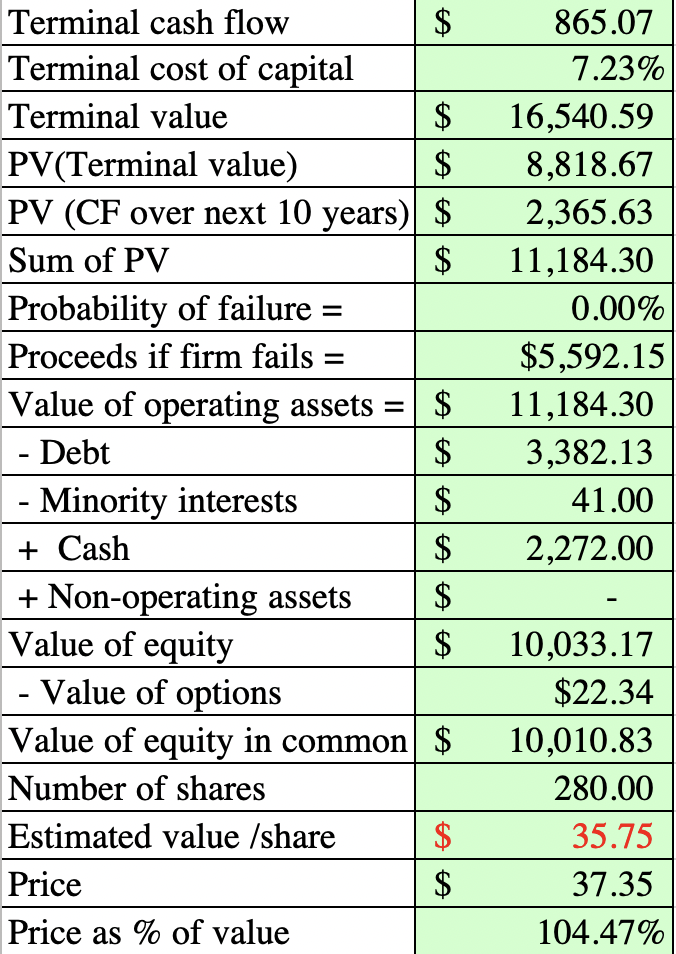
In this case, the firm realizes a decline in revenues of 30% at the start of the recession. Further, we estimate that margins receive even greater pressure resulting in operating income of $1.594 billion in year 10, about half of their current operating income. Even with these bearish assumptions, the intrinsic value for Fidelity lands at $35.75 just a few dollars off from the current price. At worst, given this bearish case, Fidelity is a hold. (This model was completed on June 29th using a risk-free rate of 3.3%)
Final Word
Given Fidelity’s long track record as a mainstay within the industry and management’s shrewd and effective style, I foresee Fidelity fully realizing stability outside of this near-term event. While the argument can be made that practically ever BBB+ rated firm traded in the United States is investable with a 10 year time horizon, I think Fidelity is especially valuable given the valuation, dividend, and commitment from management. I understand that in the short-term Fidelity will most likely experience further downside before the market stabilizes for real estate, but I think this can be offset by averaging into a position. If you are the type of investor that doesn’t care much for diversity, favors growth, and likes deep value, this stock isn’t for you, but if you are an investor who appreciates a solid dividend, can stomach near term losses for long-term value, and craves exposure, you may have found a major win.